Tutorials
Galactic Coordinates
This is a quick explanation of the Galactic coordinate system that we will be using.Search Interface
This video explains the search interface used to identify the HII region candidates.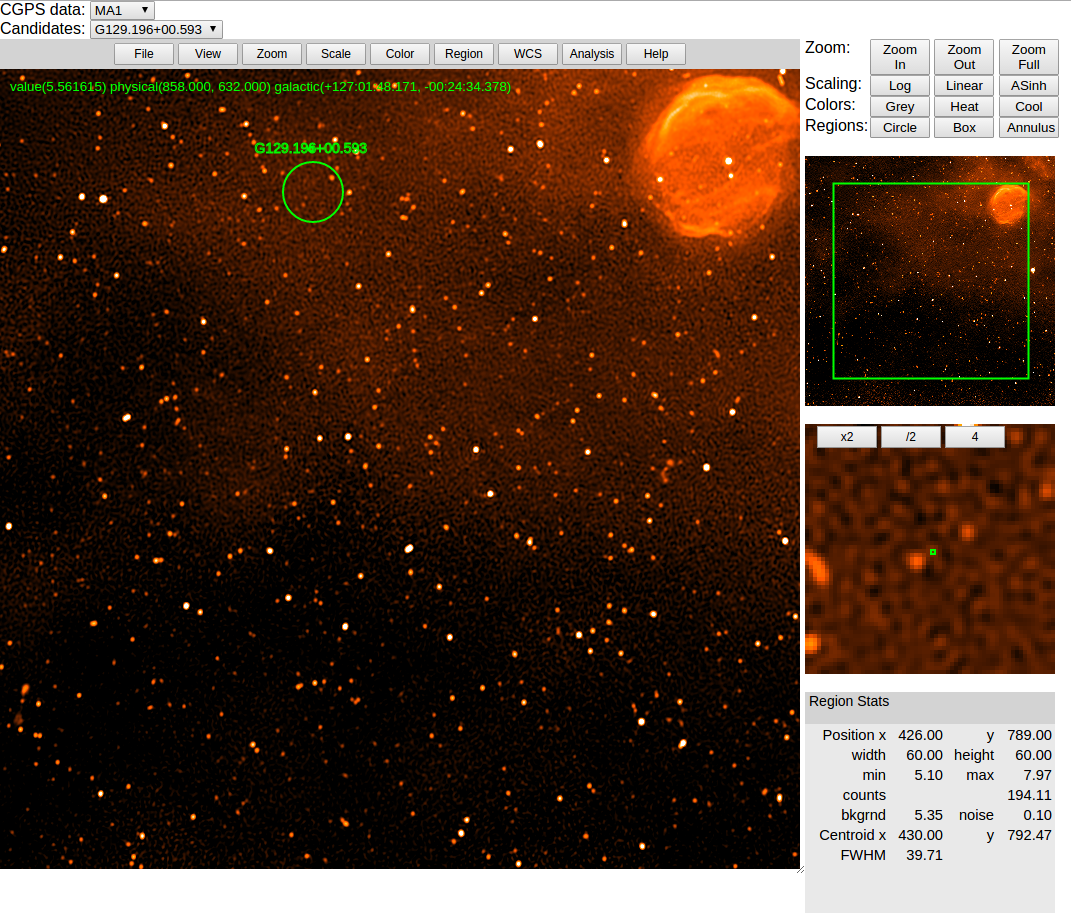 - The top left contains two dropdown menus. The "CGPS data" dropdown will load a new data set. These are 1.4 GHz data from the Canadian Galactic Plane Survey.
- The "Regions" dropdown will create region on the main display.
- The menu bar (File, View, Zoom, etc.) has many options that we hopefully won't need.
- The main display shows the selected CGPS data.
- You can change how the image is displayed by clicking your mouse button down and dragging it around the display.
- The top right contains numerous additional commands to change how the image is displayed. Play around with them!
- The top right image shows the field shown in the main display as a green box. Drag the green box around to change what is shown in the main display.
- The middle right image is a zoom of the main display at the location of the cursor.
- The bottom right box shows statistics on the currently-selected image.
- The top left contains two dropdown menus. The "CGPS data" dropdown will load a new data set. These are 1.4 GHz data from the Canadian Galactic Plane Survey.
- The "Regions" dropdown will create region on the main display.
- The menu bar (File, View, Zoom, etc.) has many options that we hopefully won't need.
- The main display shows the selected CGPS data.
- You can change how the image is displayed by clicking your mouse button down and dragging it around the display.
- The top right contains numerous additional commands to change how the image is displayed. Play around with them!
- The top right image shows the field shown in the main display as a green box. Drag the green box around to change what is shown in the main display.
- The middle right image is a zoom of the main display at the location of the cursor.
- The bottom right box shows statistics on the currently-selected image.
How to Search
This video explains how to actually measure the source properties and input those properties into the spreadsheet.6) Use the left mouse to change the display until you can see the emission clearly. 7) Select the region of interest and write the maximum value ("max") given in the box to the lower right. Write this in the spreadsheet for the region. 8) Note the background value ("bkgrnd"). Write this in the spreadsheet. 9) Fill out the rest of the spreadsheet entries for this source.
Possible Issues
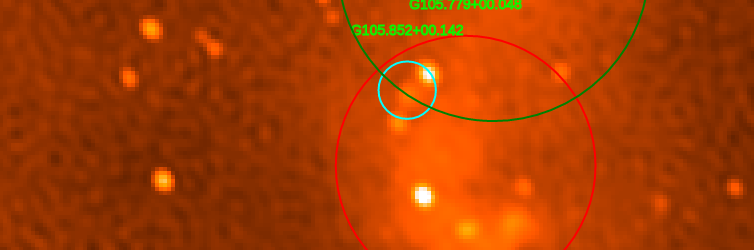
Here are some possible issues you may encounter, and how best resolve them. 1) Complicated regions. Below is a source (cyan) that has another bright source within the circle. This other bright source is unrelated, so the max value within the can circle will be incorrect.Solution: change the position or size of the cyan circle until it only includes the small (faint) source.
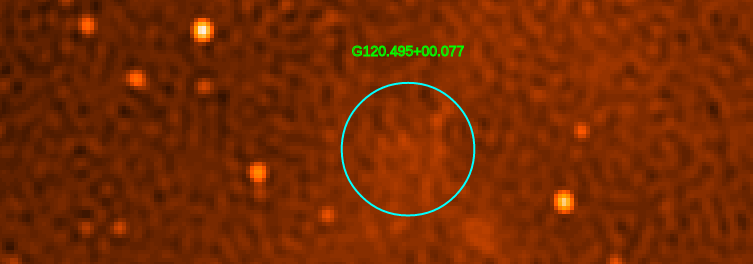
 2) Faint regions. Some regions are really faint and there doesn't
seem to be anything there. Solution: If there is nothing else
complicating the analysis (#1 above), then just measure the values
from the default circle.
2) Faint regions. Some regions are really faint and there doesn't
seem to be anything there. Solution: If there is nothing else
complicating the analysis (#1 above), then just measure the values
from the default circle.
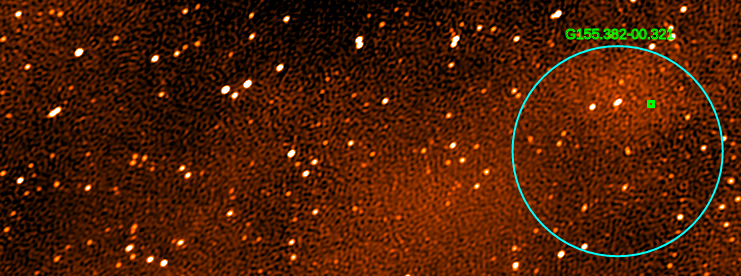
 3) Large regions. Large regions will always have lots of complicating sources within them, and they will furthermore be faint (#1 and #2 above). Solution: make the circle smaller until it is measuring only the faint diffuse emission (if you can identify it!). For the source below, one possible location is indicated by the small green square.